Here are the results of the independent WSER Runner Survey from the June 27-28, 2015 race, conducted by ultralive.net.
All runners have to go through check-in the day before the race in Squaw Valley and the survey team was positioned at the entrance of the check-in. Participation was completely voluntary and 94% of starters took some extra time to answer the 10 questions. We were able to correlate the data to finish times to make the analysis even more interesting.
Survey Questions
The runners were asked the following questions:
- Number of 100’s completed
- Number of years running ultras
- Will they use a crew?
- Will they use a pacer?
- Did they attend the Memorial weekend training camp
- Shoe brand
- Sock brand
- Pack Type
- Lighting system
- Did they pay for coaching services?
For 2015 edition of the WSER, there were 371 official starters, 254 finishers (68.5%) in under 30 hours, and 96 finishing (25.9%) under 24 hours for the coveted Silver Buckle.
The survey had 349 participants (94% of the entrants) including nearly all of the elite runners. Of the survey participants 238 finished (68.2%) and 90 finished in under 24 hours (25.8%).
Note: All graphs show numbers related to runners who participated in the survey and finished the race in under 30 hours.
Finish Hour
For sub 24 hour finishers, 28 out of 90 (31.1%) finished in the 23rd hour of the race to get a silver buckle. In the last two hours of the race, there were 81 (34%) finishers. The busiest times on the track are between 4-5 AM and 9-11 AM on Sunday morning. The graphs show the distribution of finishers by hour (14 hours to 29 hours). The first graph shows the average number of years running ultras compared to finishing time. The data implies that the number of years of experience does not correlate to a faster or slower finish time. The second graph shows the number of runners utilizing a crew or pacer compared to finishing time. Of the survey participants, 21 finished without a crew (8.8%) and 29 finished without a pacer (12.2%). And 10 (4.2%) hardcore participants finished without a crew and pacer. And finally, 3 of the 10 “screwed” runners earned a Silver Buckle.


Shoes
For the second year in a row Hoka was the dominant shoe for all finishers regardless of the group. For the sub 24 hour finishers, Altra took over second place after not even being on the radar in last year’s survey. Again, Brooks was a strong second when you look at the overall finishers.


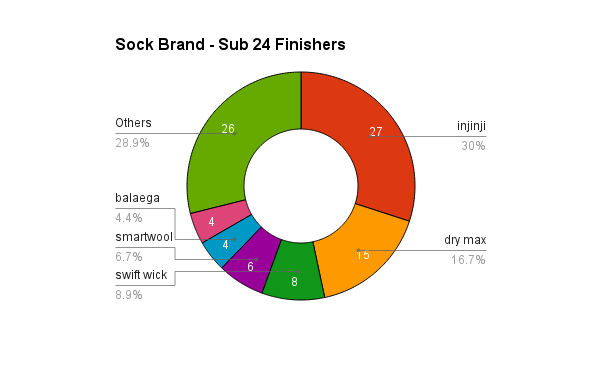
Socks
Injinji was the clear choice for both the overall and sub 24 groups. Drymax was again second in both groups as well. The “others” category is quite large and might mean people need to pay attention to what they wear on their feet.

Paid Coaching Services
It seems there are a lot of ultrarunning coaching services out there yet very few WSER finishers use them. Maybe because a lot of the coaches actually ran the race this year. Or ultrarunners are an independent bunch and don’t like a training schedule. The percentage was even lower than last year (2014 – 20.3% had a coach)


Lighting
For the second year in a row, Petzl was the favorite light brand for runners finishing the race.
This year only the first 5 finishers (sub 16 hours) ran without the assistance of lights as compared to 9 in 2014.
And we are pretty sure Rob Krar didn’t even pack a headlamp again.


Packs
Ultimate Direction dominated as the choice of pack for both sub 24 hour and overall finishers. For the faster runners (sub 24), the Salomon pack was second favorite and Nathan was third. This order flip-flopped for the overall finishers.


Data Accuracy
- 371 runners started the 2015 Western States 100 Mile Endurance Run
- Ultralive.net team surveyed a majority of those runners through the registration process at Squaw
- Final survey reflects N = 349 athletes though individual questions may vary if athlete did not answer or know answer
- Most graphs reflect data from the group of athletes who completed the race (238 in the survey finished)
Credits
Many thanks to the ultralive.net survey team: Kara Teklinski, Monique Winkler and Emily Yu.
Graphs and comments by Ted Knudsen.