Here are the results of the independent WSER Runner Survey from the June 25-26, 2016 race, conducted by ultralive.net.
All runners have to go through check-in the day before the race in Squaw Valley and the survey team was positioned at the entrance of the check-in. Participation was completely voluntary and 94% of starters took some extra time to answer the questions. And we were able to correlate the data to finish times to make the analysis even more interesting.
Here are the surveys from 2014 and 2015.
Survey Questions
The runners were asked the following questions:
- Number of 100’s completed
- Number of years running ultras
- Will they use a crew?
- Will they use a pacer?
- Did they attend the Memorial weekend training camp
- Shoe brand
- Sock brand
- Pack Type
- Lighting system
- Did they pay for coaching services?
For 2016 edition of the WSER, there were 353 official starters, 280 finishers (79.3%) in under 30 hours, and 102 finishing (28.9%) under 24 hours for the coveted Silver Buckle.
The survey had 351 participants and all of the sub 24 hour finishers are included in the survey. A total of 277 of the 280 finshers (99%) are in the survey.
Note: All graphs show numbers related to runners who participated in the survey and finished the race. DNS and DNF are not included in the final graphs.
Finish Hour
For sub 24 hour finishers, 30 out of 102 (29.4%) finished in the 23rd hour of the race to get a silver buckle. In the last two hours of the race, there were 113 (40%) finishers. The busiest times on the track are between 4-5 AM and 9-11 AM on Sunday morning. The graphs show the distribution of finishers by hour (15 hours to 29 hours). The first graph shows the average number of years running ultras compared to finishing time. The data implies that the number of years of experience does not correlate to a faster or slower finish time. The second graph shows the number of runners utilizing a crew or pacer compared to finishing time. Of the survey participants, 25 finished without a crew and 36 finished without a pacer. And 17 hardcore participants finished without a crew and pacer (NCNP). And finally, 4 of the 17 NCNP earned a Silver Buckle.


Shoes
For the third year in a row Hoka was the dominant shoe for all finishers regardless of the group. Altra is now a strong second shoe of choice regardless of the finish time. Brooks fell to third most popular shoe with the overall finishers. Some runners did plan to change shoes during the race and may have changed to a different brand, but the data reflects only the brand that they started the race wearing.


Socks
Injinji was the clear choice again for all finishers. Drymax’s popularity increased since last year though it still remained a close second in both groups.


Paid Coaching Services
There was a slight increase in the number of athletes using coaching services but it is still a relatively low percentage of the finishers. Maybe because a lot of the coaches actually ran the race this year. Or ultrarunners are an independent bunch and don’t like a training schedule. The percentage was nearly identical to last year (2015 – 17.2%)
Although most of the data presented here reflects only finishers, it is interesting to include that of all starters, 40% used a coaching service.


Memorial Weekend Training Camp
The training camp held on Memorial Weekend was well attended by both types of finishers and both groups had nearly identical percentages. While previewing the course definitely helps it is not required to finish the race.


Lighting
For the second year in a row, Petzl was the favorite light brand for runners finishing the race.
This year only first place finisher Andrew Miller (sub 16 hours) ran without the assistance of a light as compared to 5 in 2015.


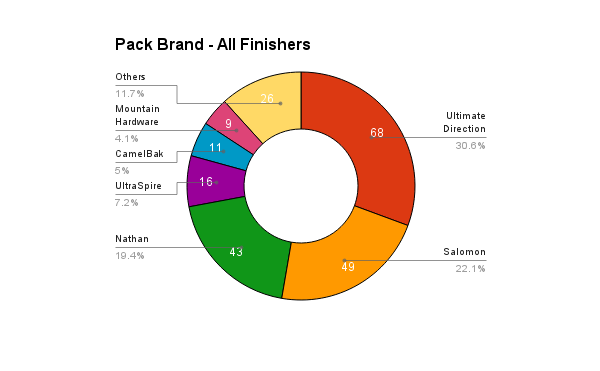
Packs
Ultimate Direction dominated again as the choice of pack for both sub 24 hour and overall finishers. For the faster runners (sub 24), the Salomon pack was second favorite and Nathan was third. This order flip-flopped for the overall finishers.
Handhelds: many runners did not carry a pack. 32% of the sub 24 hour finishers preferred this method. Only 19% of the overall finishers used handheld bottles.

Data Accuracy
- 353 runners started the 2016 Western States 100 Mile Endurance Run
- Ultralive.net team surveyed a majority of those runners through the registration process at Squaw
- Final survey reflects N = 351 athletes though individual questions may vary if athlete did not answer or know answer
- All graphs reflect data from the group of athletes who completed the race (277 of the 280 finishers completed the survey)
Credits
The team would like to thank all of the runners who took time to talk with us and answer these questions.
Many thanks to the ultralive.net survey team: Kara Teklinski, Emily Yu and Jessi Goldstein.
Analysis by Kara Teklinski and Ted Knudsen.