Here are the results of the independent Western States Endurance Run (WSER) Runner Survey from the June 24-25, 2023 race, conducted by ultralive.net.
WSER runner registration takes place in Olympic Valley Friday before race day and 2023 allowed for another year of the ultralive survey team to be in position. Runners are happy to participate while they wait in line for check-in providing us a 93.9% participation rate of the 379 starters.
Here are the surveys from 2014, 2015, 2016, 2017, 2018, 2019. and 2022.
Survey Questions
The runners were asked the following questions. Data was recorded by bib number allowing us to correlate the responses to finish times to make the analysis even more interesting. All data however is compiled and reported anonymously:
- Number of 100’s completed
- Number of years running ultras
- Will they use a crew?
- Will they use a pacer?
- Did they attend the Memorial weekend training camp
- Shoe brand
- Sock brand
- Pack type/brand
- Lighting brand
- Watch brand
- Did they pay for coaching services?
This year’s race temps were “cool” and we saw the top 10 for women and men finish in very fast times. The top 10 women finished under 18:11 and the top 10 men finished under 16:09. Of the 379 starters we saw 328 finishers (86.5%) under 30 hours of which 110 (33.5%) finished under the coveted 24 hour mark for a Silver Buckle. The finish rate is the hightest rate since the early years when 100% completed (when only 1 runner on the course).
A total of 306 of the 328 finshers (93.3%) are in the survey.
Note: All graphs show numbers related to runners who participated in the survey and finished the race. DNS and DNF are not included in the final graphs.
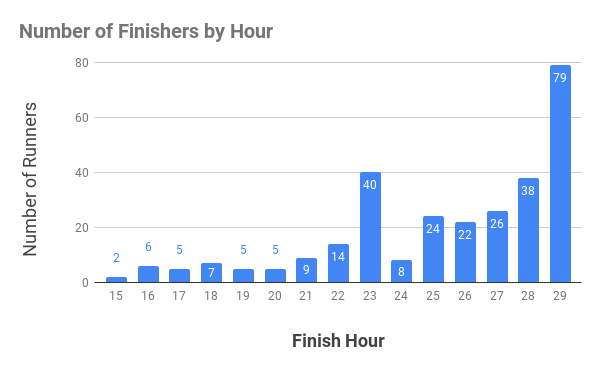
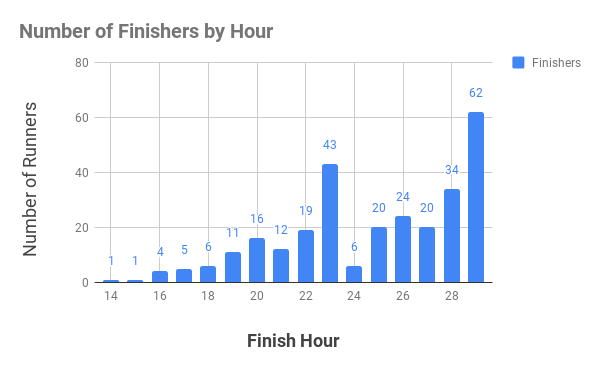
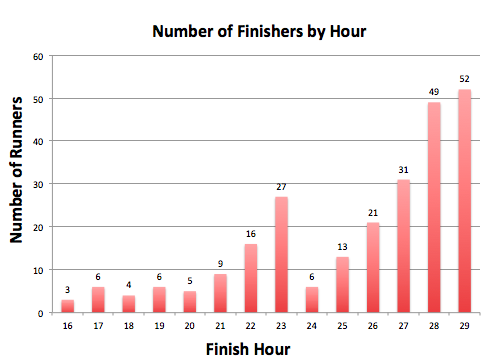
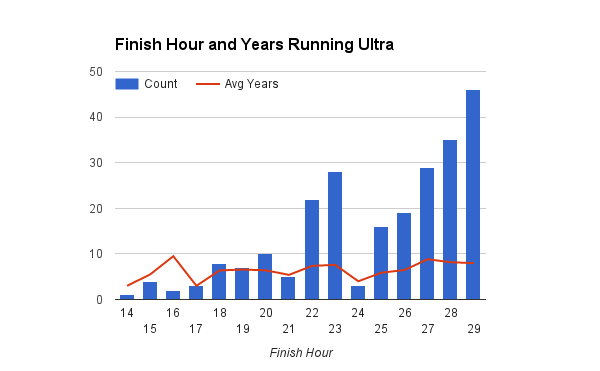
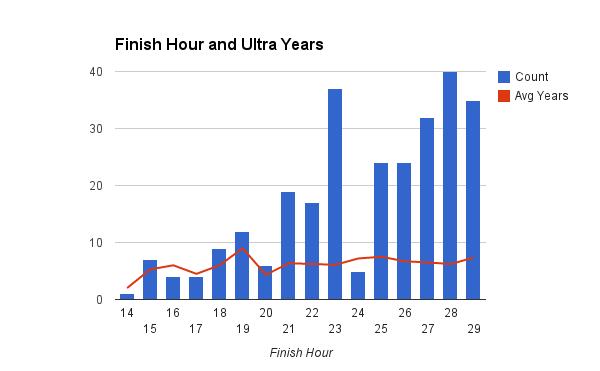
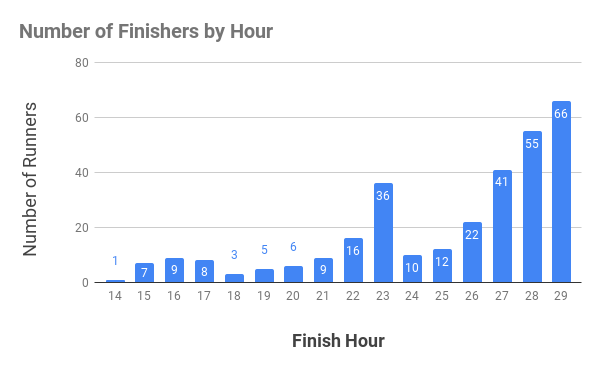
Finish Hour
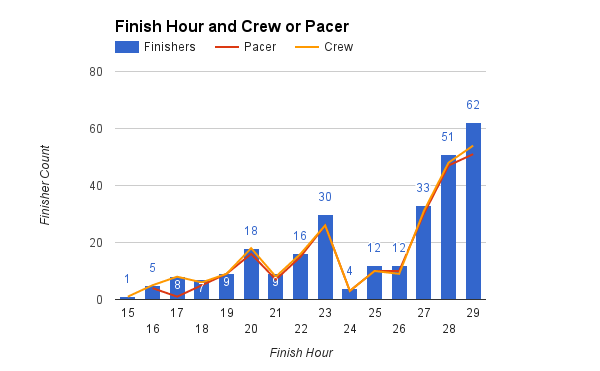
For sub 24 hour finishers completing the survey, 36 out of 110 (33%) finished in the 23rd hour of the race to get a silver buckle. This was slightly less than in the past couple of years most likely due to the cooler temperature which allowed for faster finish times. In the last two hours of the race, there were 121 (37%) finishers. The busiest times on the track are typically between 4-5 AM and 9-11 AM on Sunday morning and 2023 proved no different.
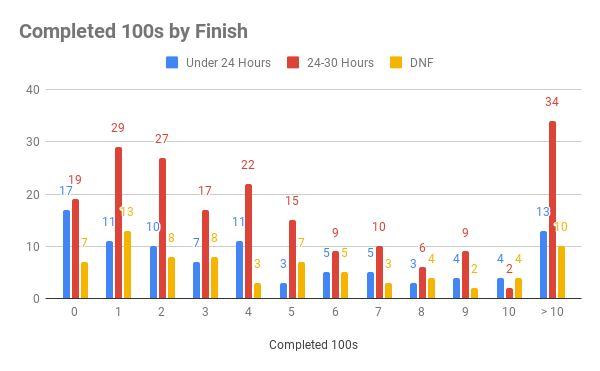
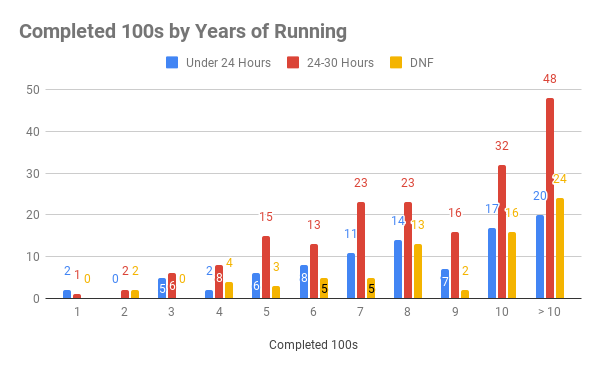
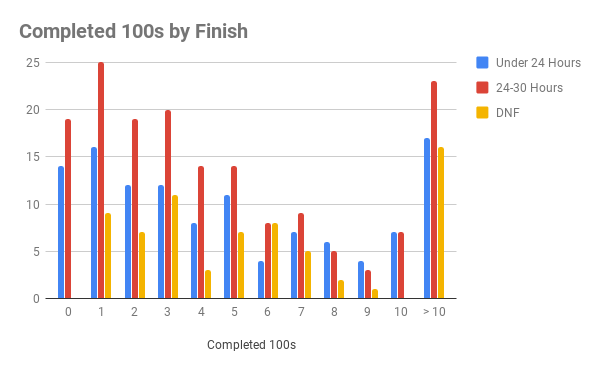
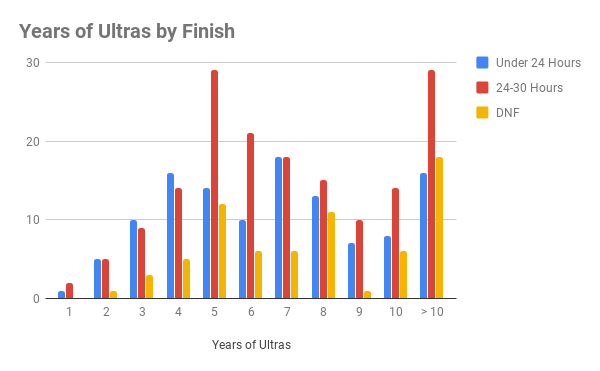
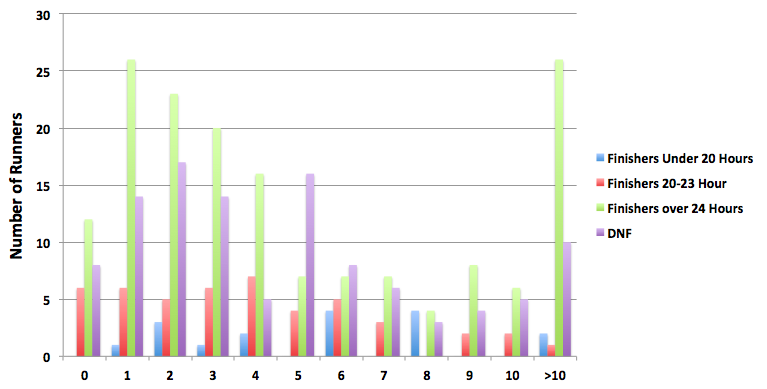
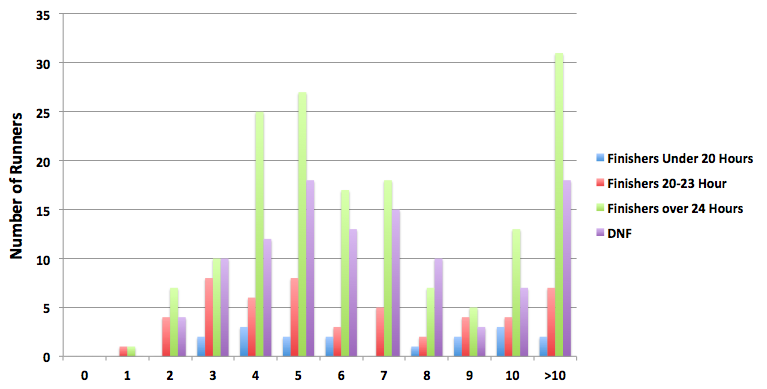
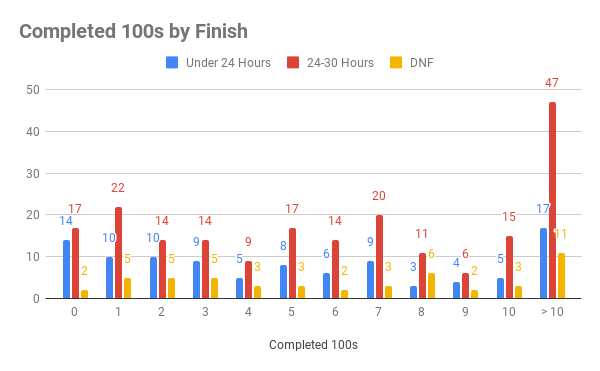
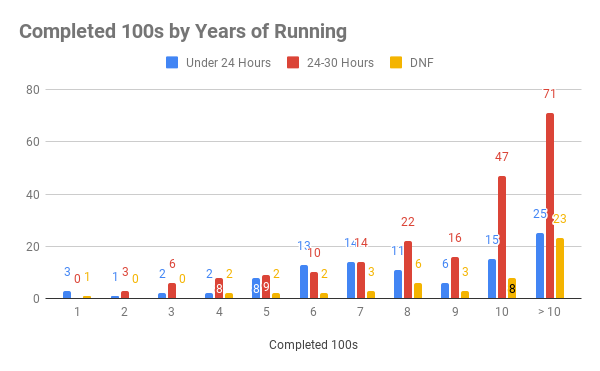
The graphs show the distribution of finishers by hour (14 hours to 29 hours), distribution of finishers by completed 100 mile races, and distribution of finishers by year of running ultras. Interestingly, many of the finishers over 24 hours have finished more than ten 100 mile races and have been running ultras over 10 years.
Despite the high country snow at the beginning of the race, the cool temperatures in this year’s race definitely attributed to the finish rate of 86.5%.
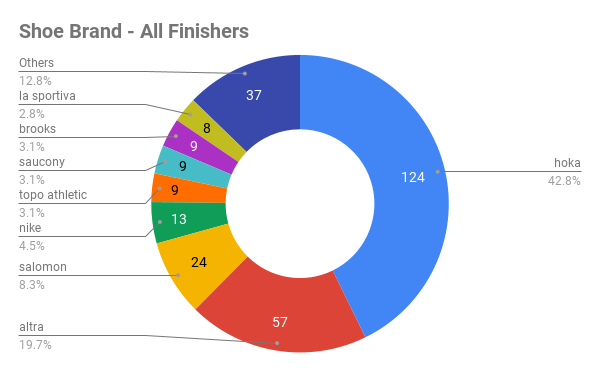
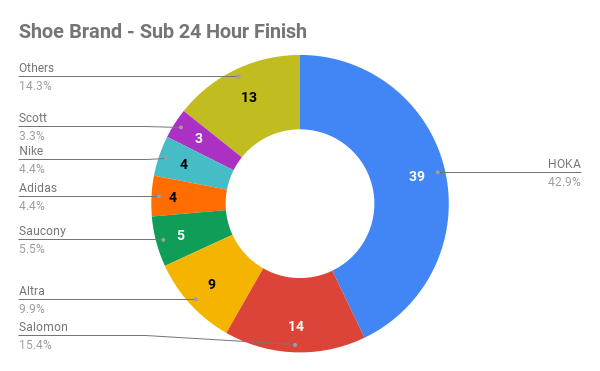
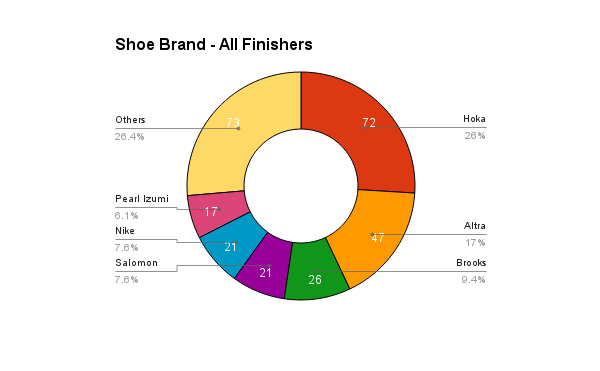
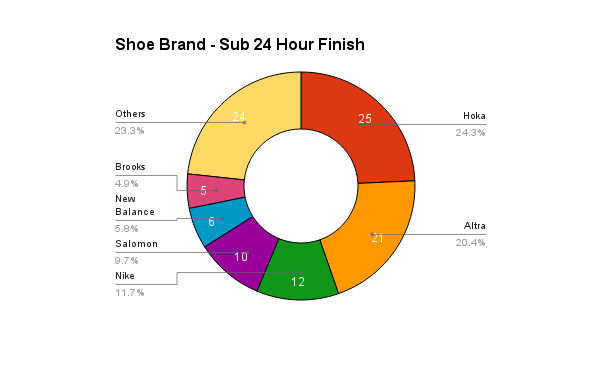
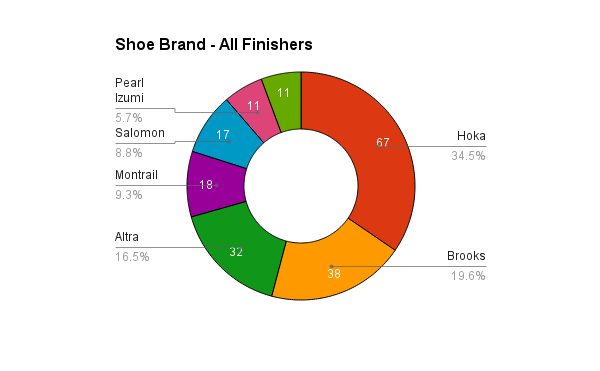
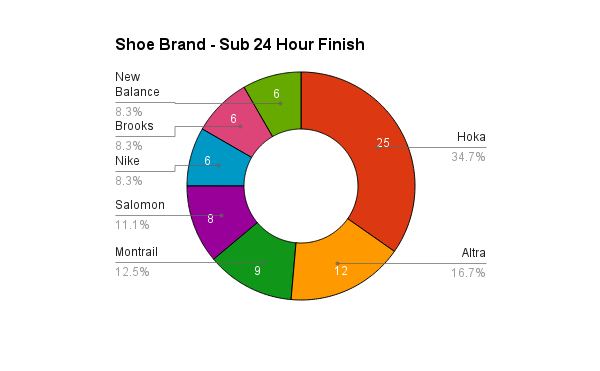
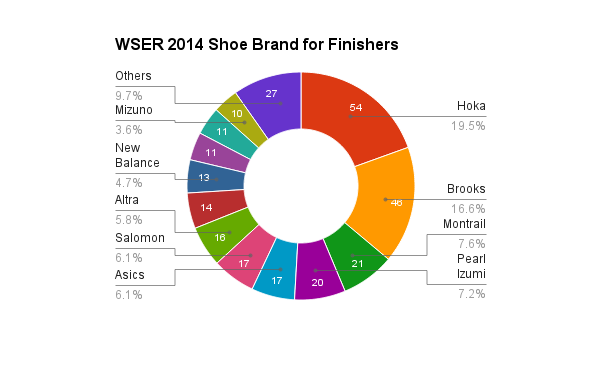
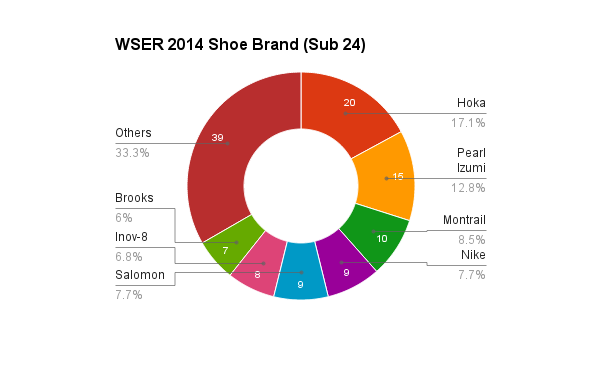
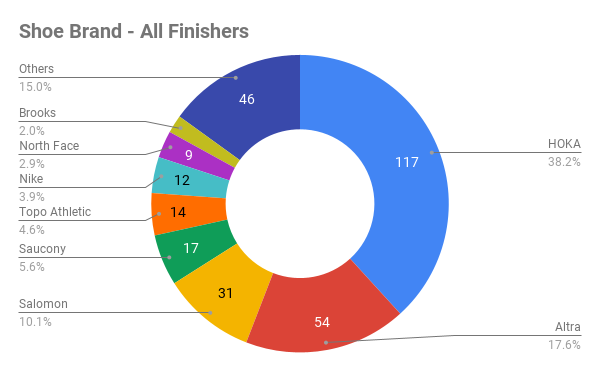
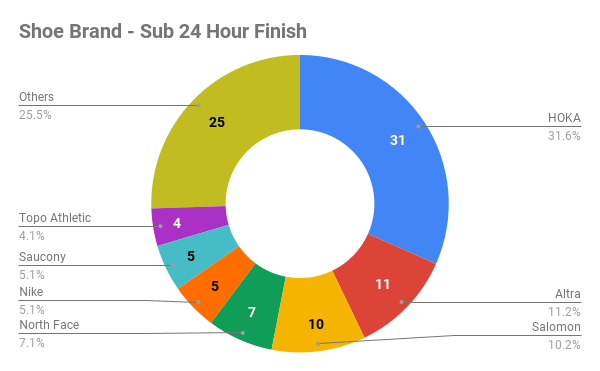
Shoes
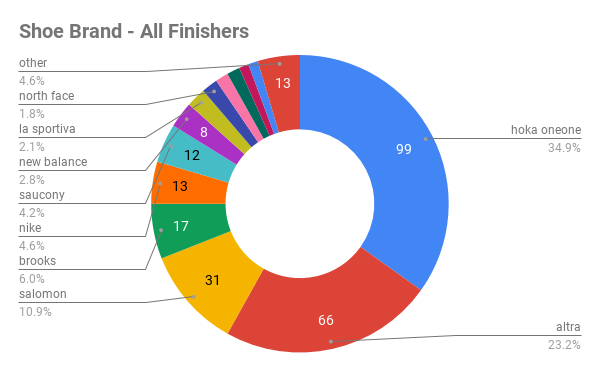
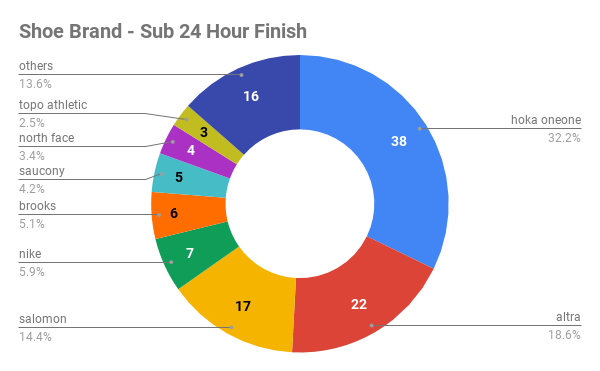
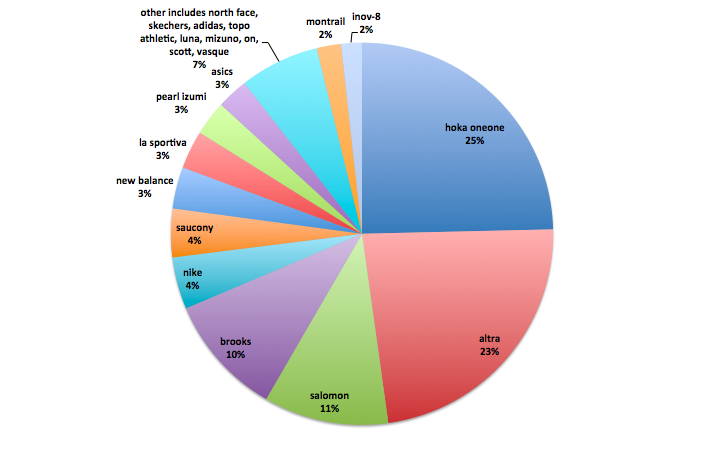
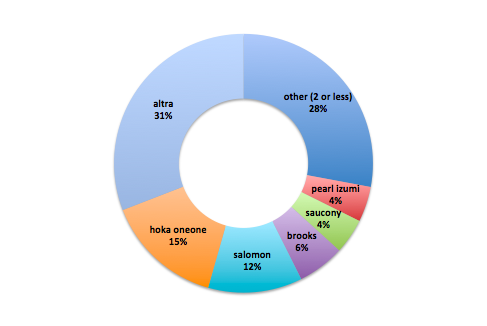
Again Hoka was the most popular shoe (38.2%) for all finishers with Altra in second place with 17.6% and Salomon in third (10.1%). The rankings stayed the same for the sub-24 hour finishers. Hoka has been the top brand in the survey since it started in 2014. We acknowledge some runners did plan to change shoes during the race and may have changed to a different brand so we asked that they provide the brand they planned on using most of the race.
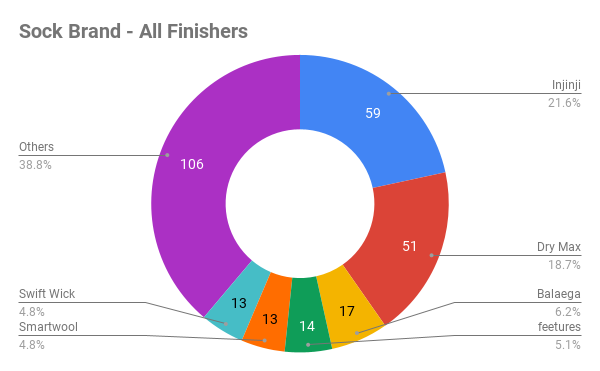
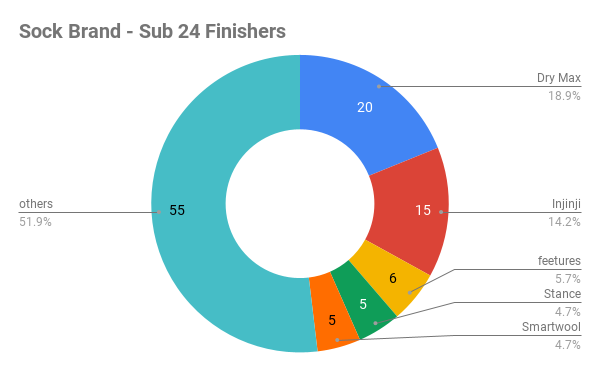
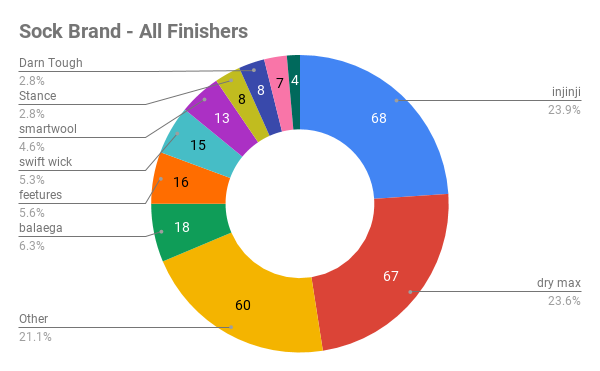
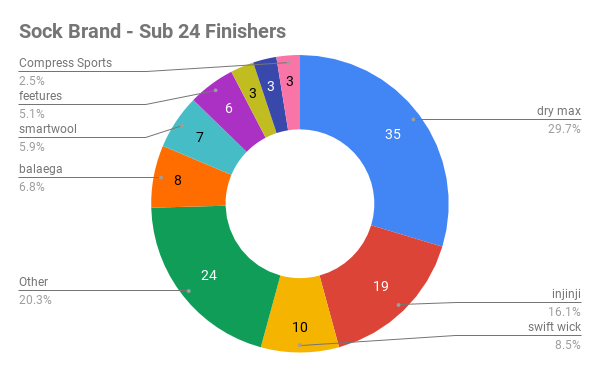
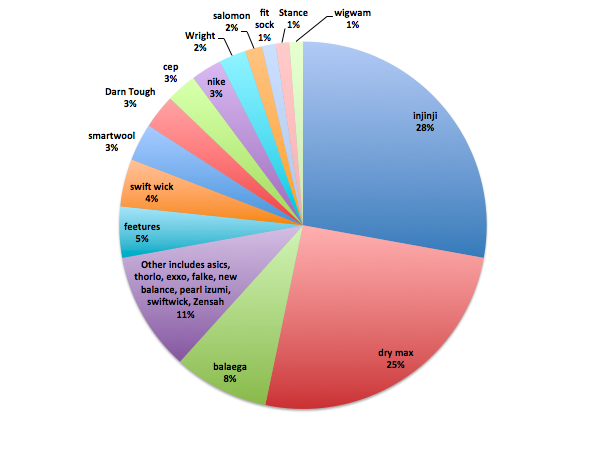
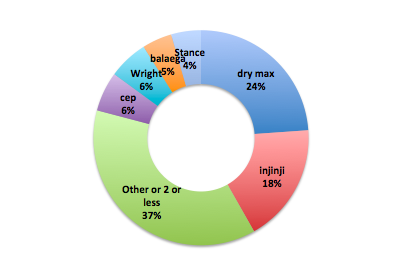
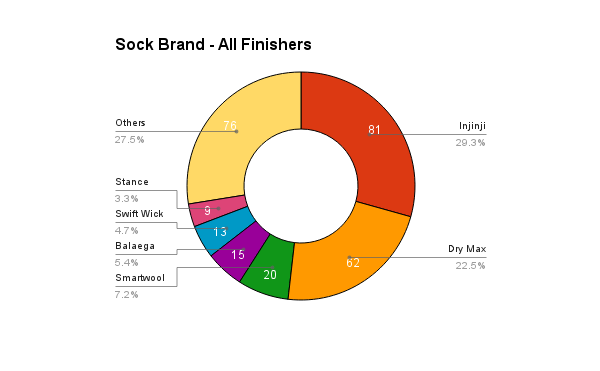
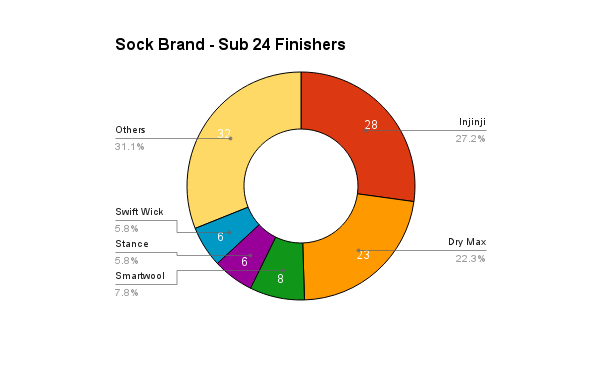
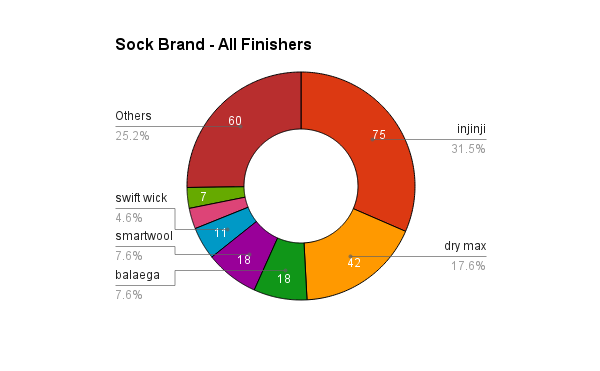
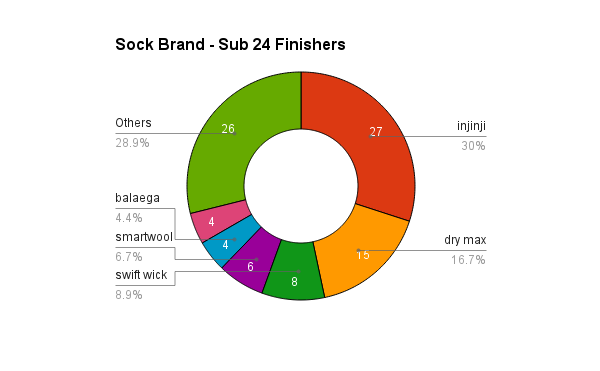
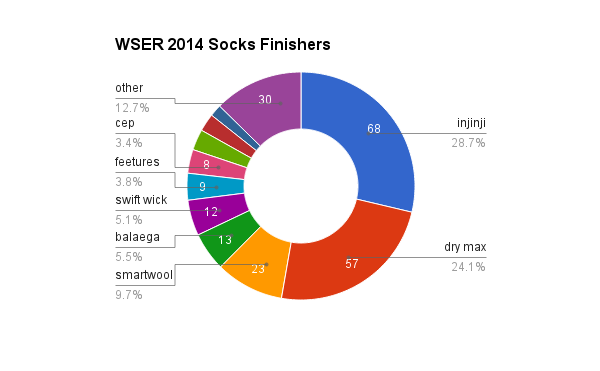
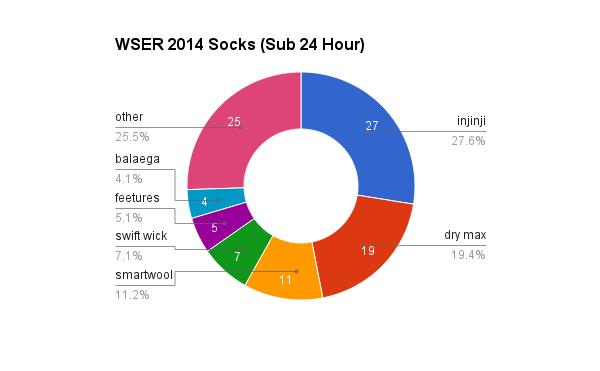
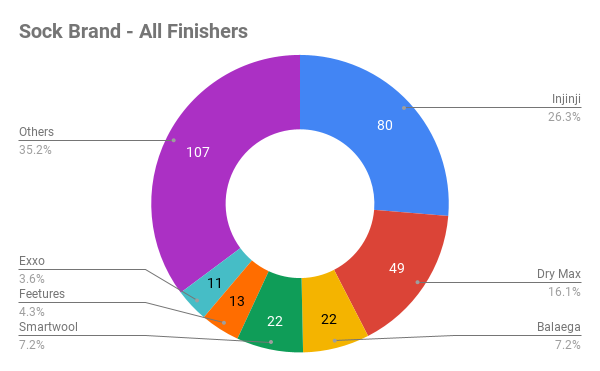
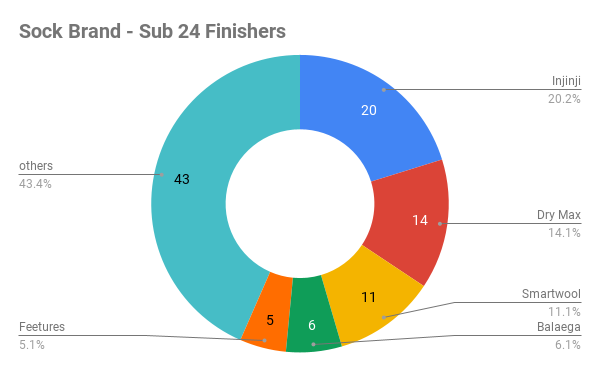
Socks
Injinji is now the strong favorite for all finishers with Drymax coming in second again. The “other” category was quite large this year and runners seem to like a large variety of socks.
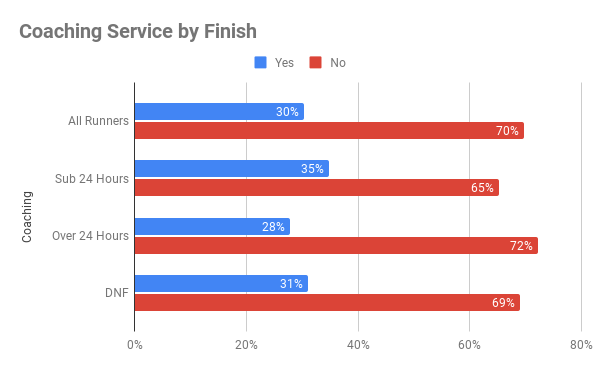
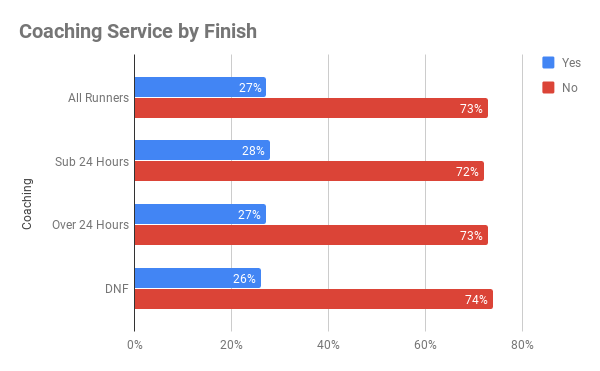
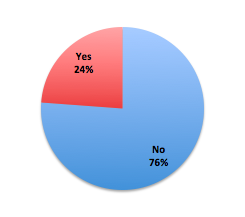
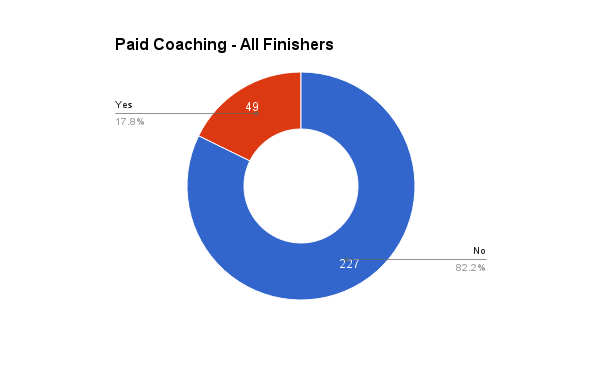
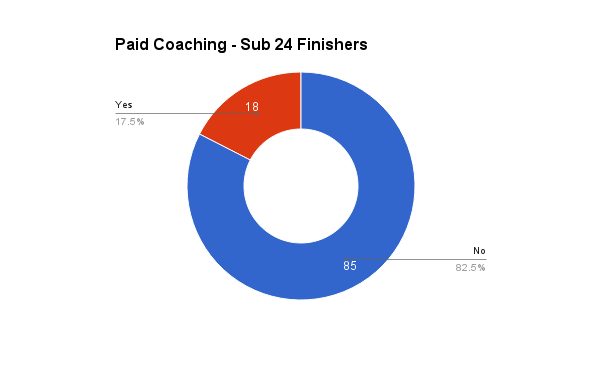
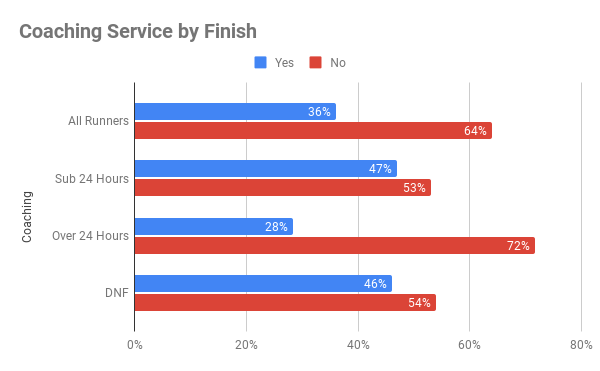
Paid Coaching Services
36% of the runners use a paid coaching service overall. Sub-24 hour finishers have fully embraced coaching now and nearly half (47%) use a coach.
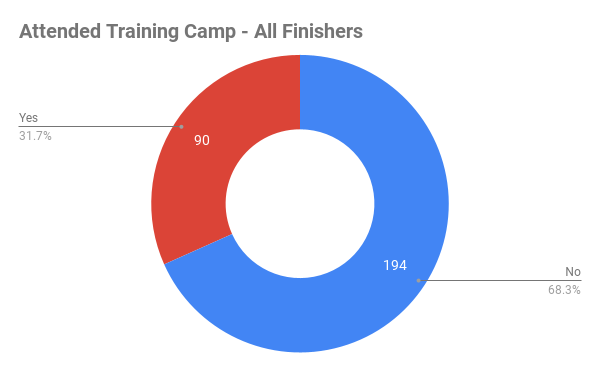
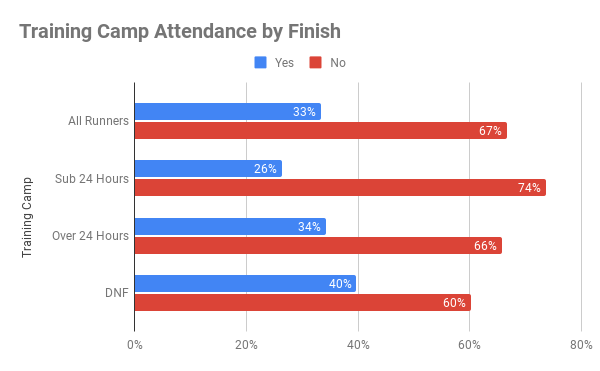
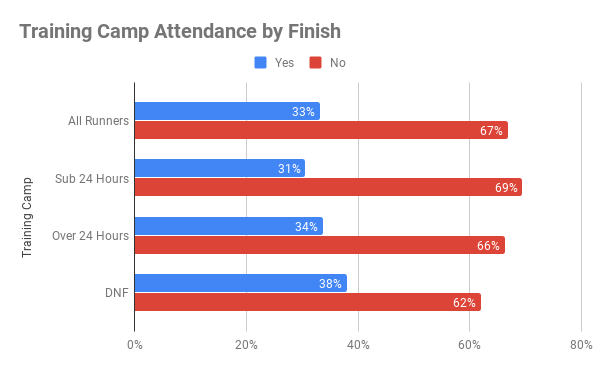
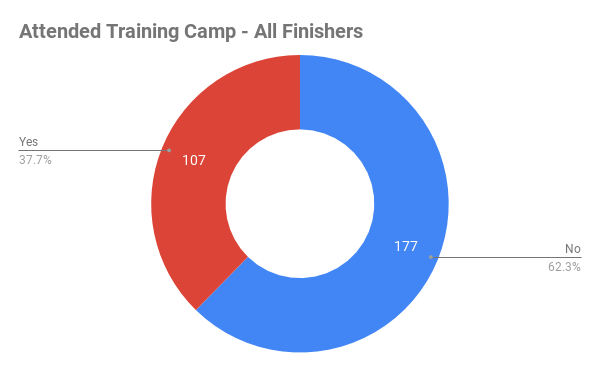
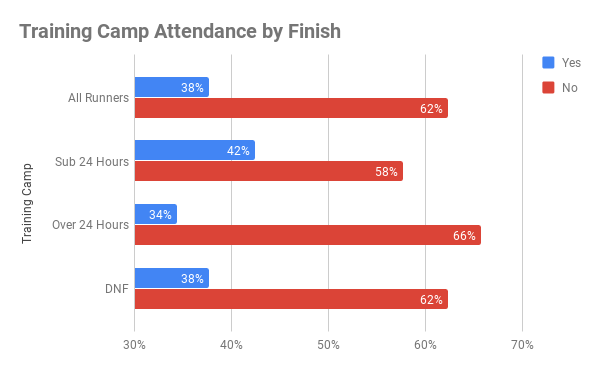
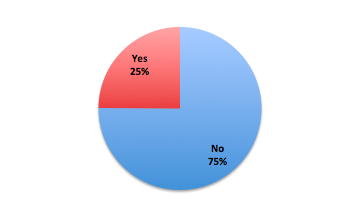
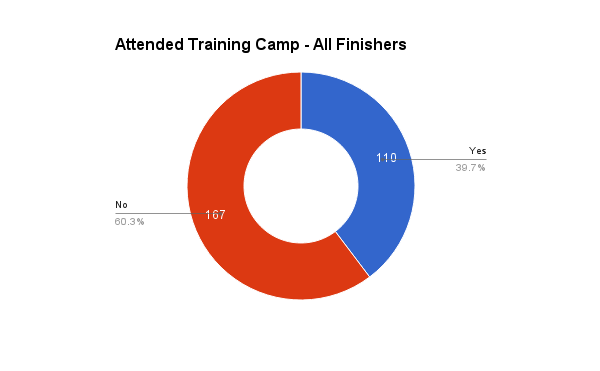
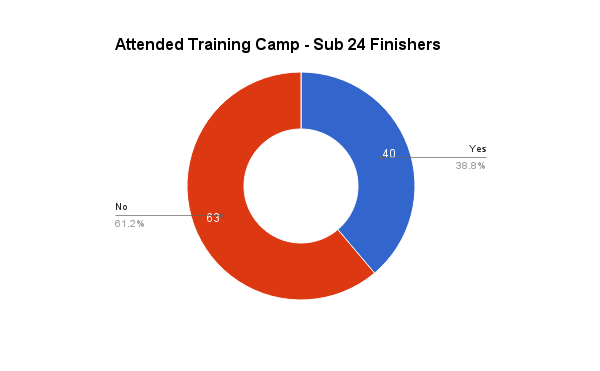
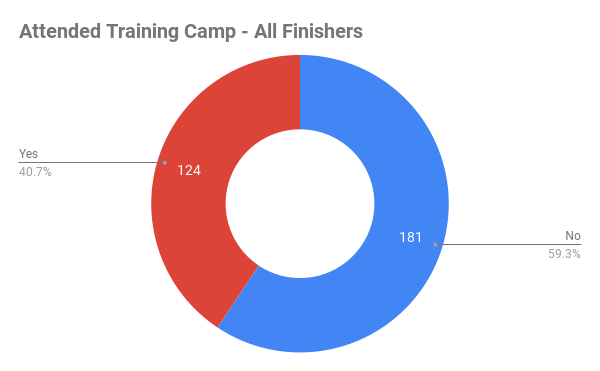
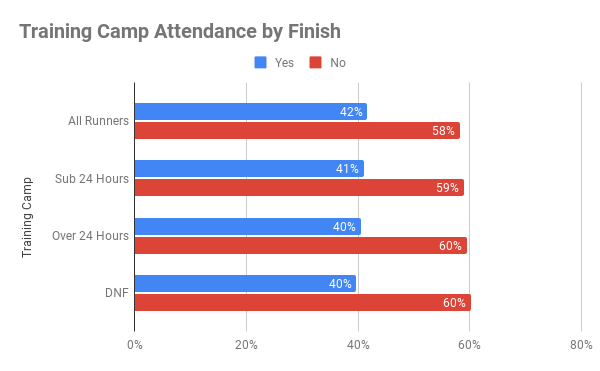
Memorial Weekend Training Camp
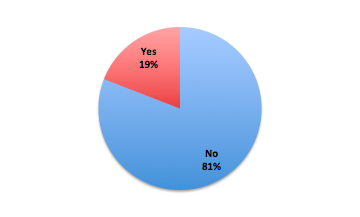
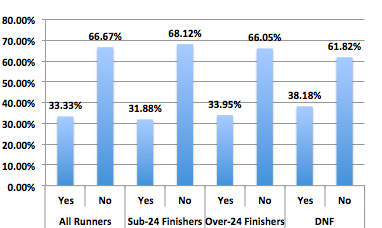
The training camp held on Memorial Weekend is a great weekend to get on the course for those running, supporting or spectating the race. Attendance is up with 40% of finishers now attending the weekend. However, attending camp does not seem to decrease the chance of a DNF as 40% of the runners who did not complete the race were at the training camp.
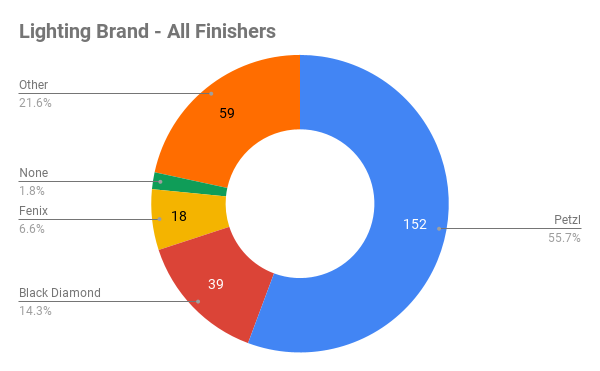
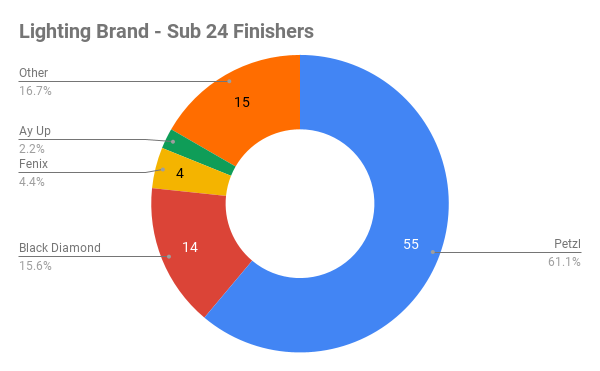
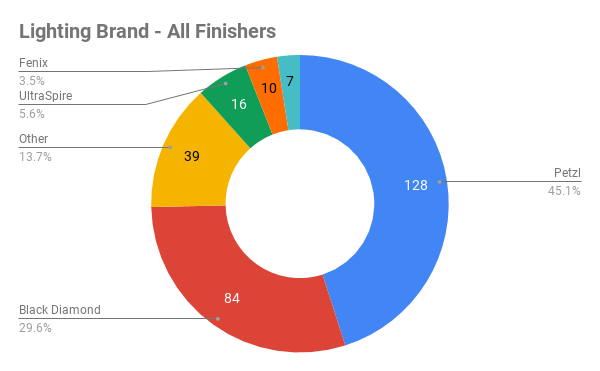
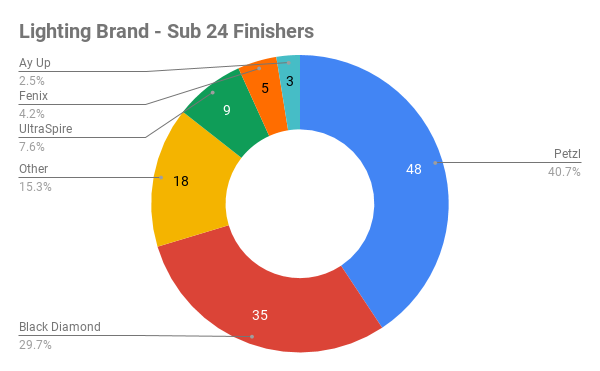
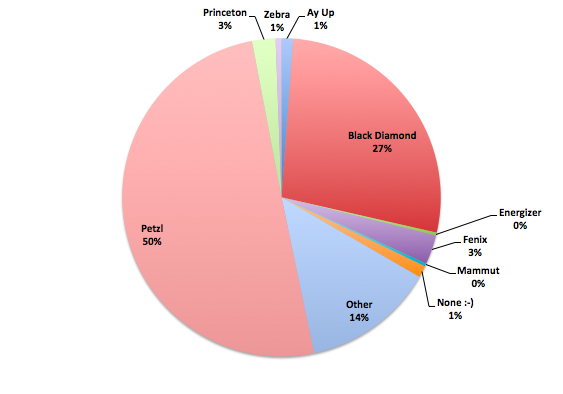
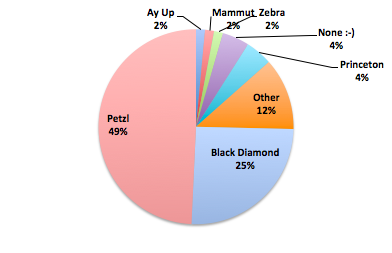
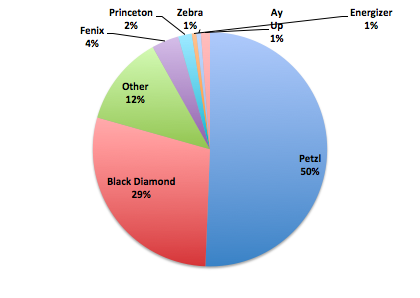
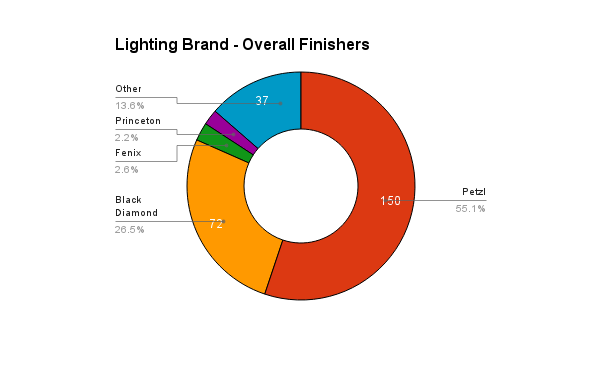
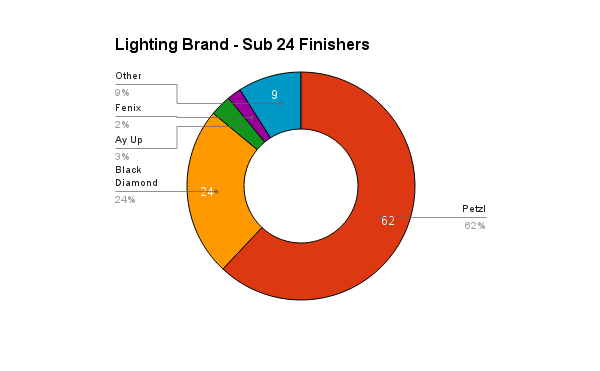
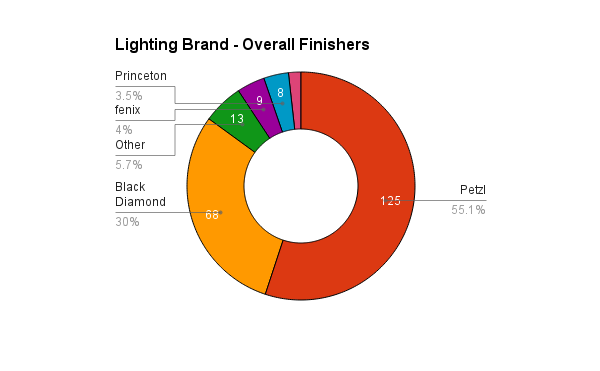
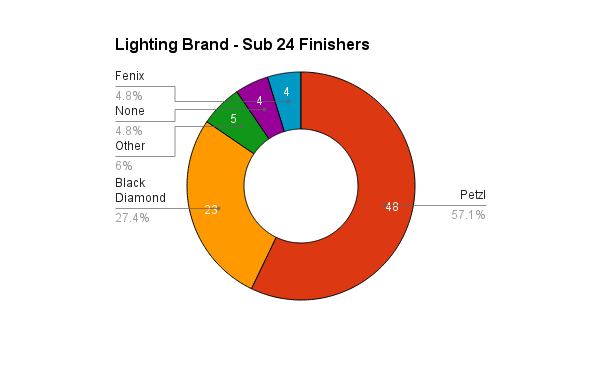
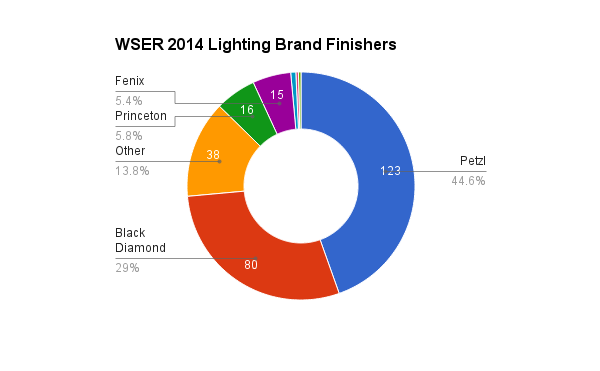
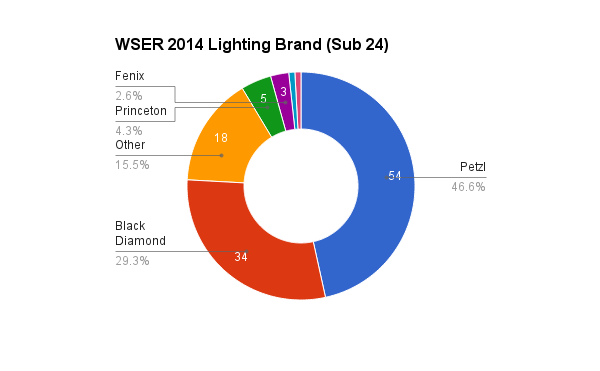
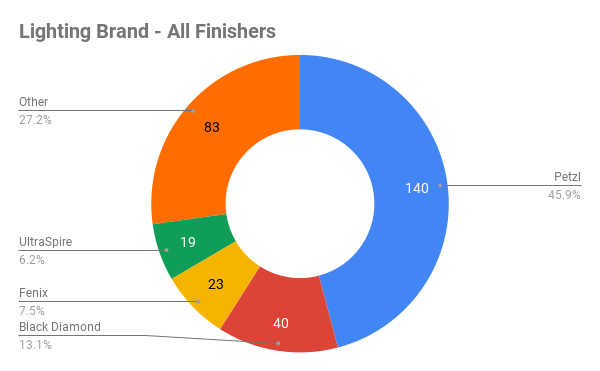
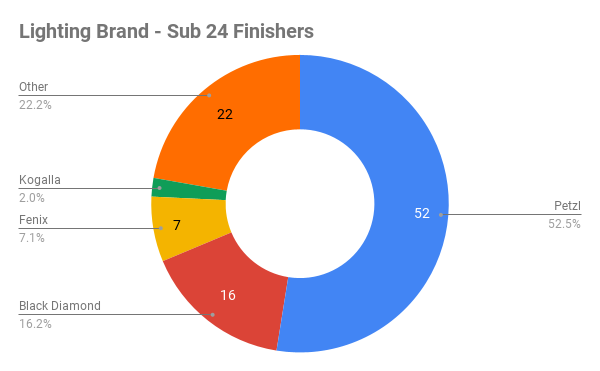
Lighting
Petzl’s remains the favorite light brand for all runners regardless of finish time (sub or over-24 hour) with Black Diamond second again.
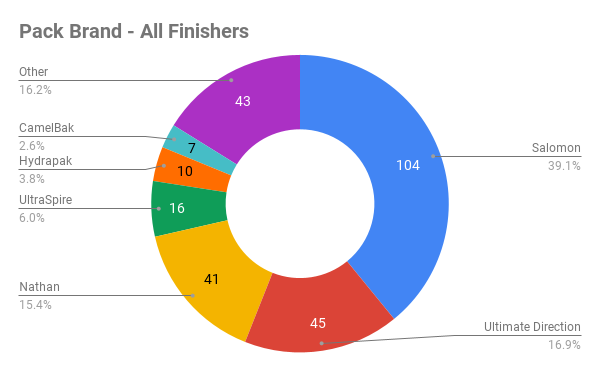
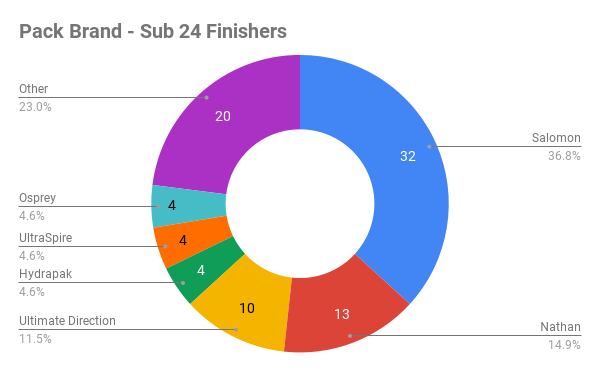
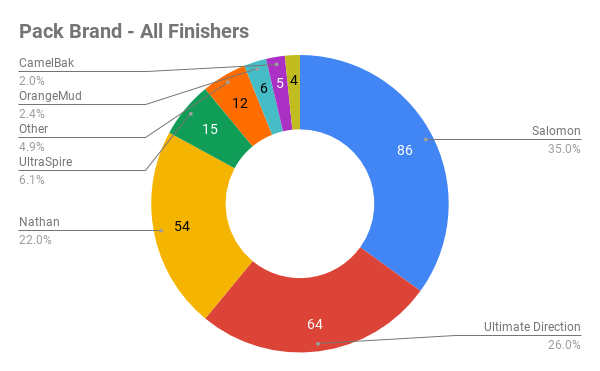
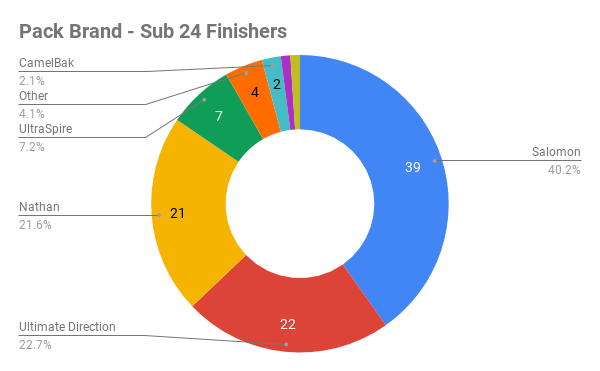
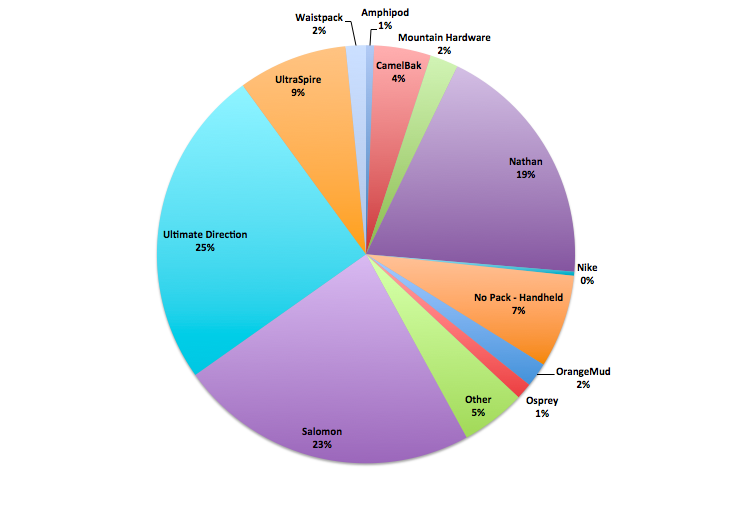
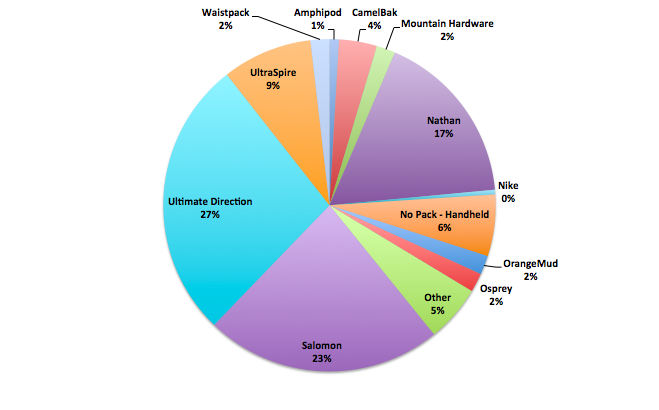
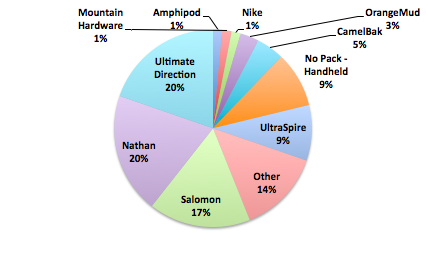
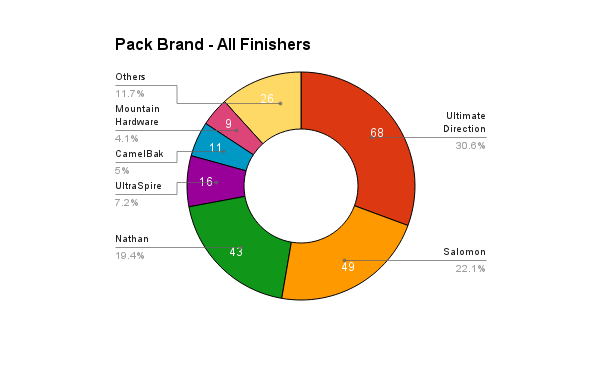
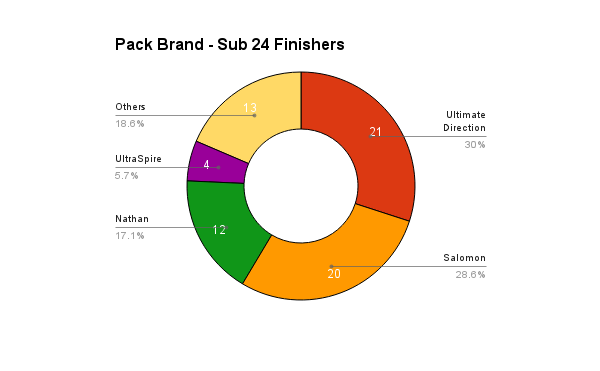
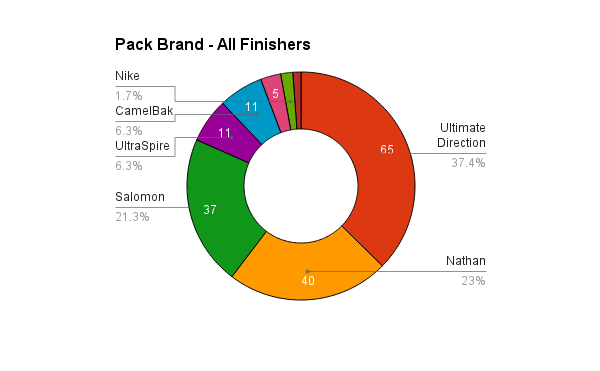
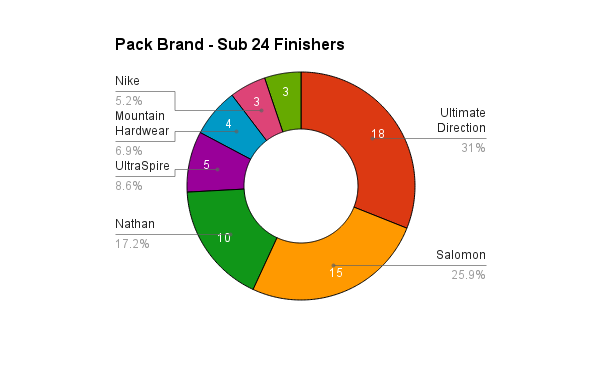
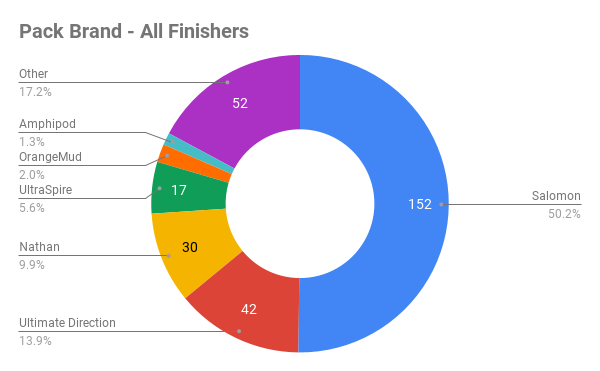
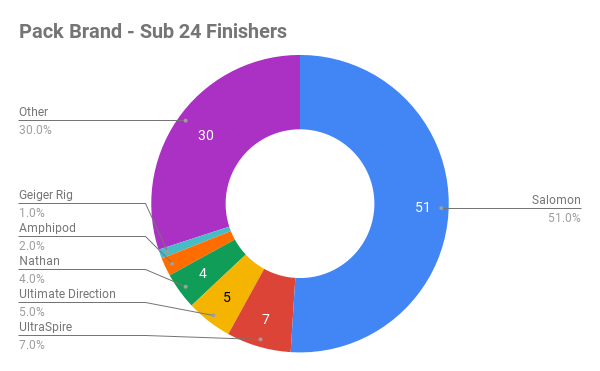
Packs
Salomon was the top choice for all runners (sub 24 and overall) and at 50% is by far the most common pack in the race.
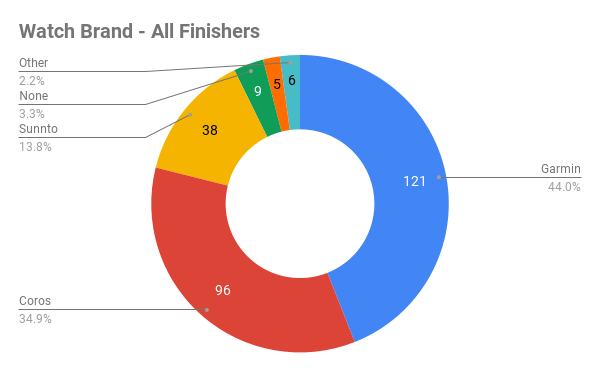
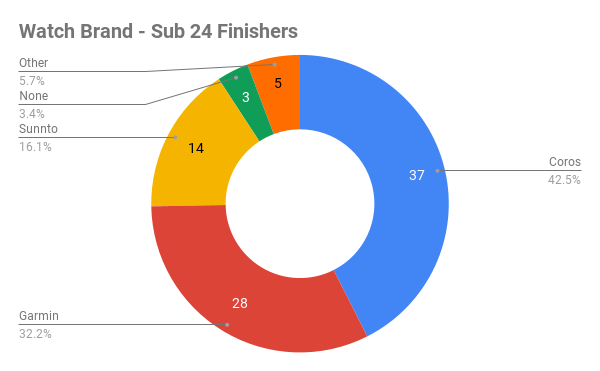
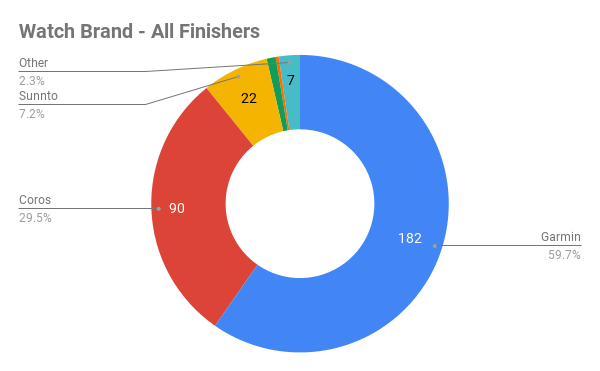
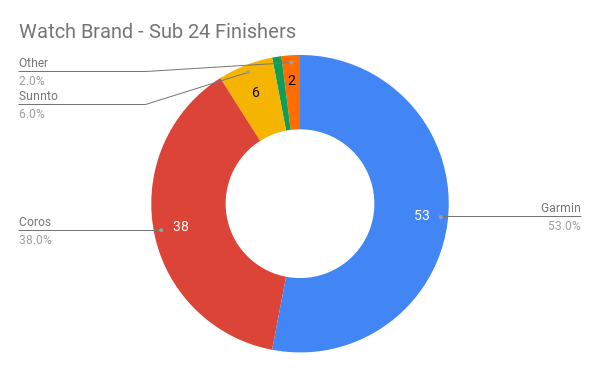
Watches
Garmin was the most popular watch overall in the survey. Coros is the second most popular and combined those two brands make up 90% of the watches worn in the race.
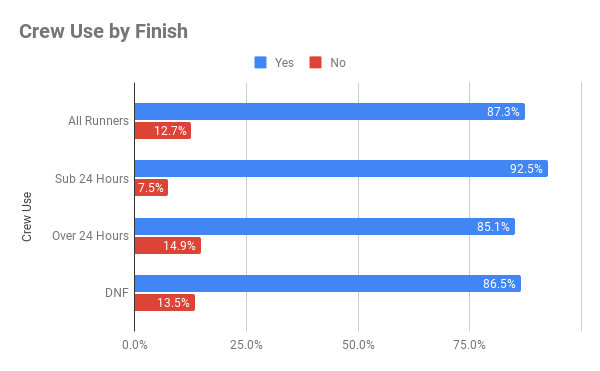
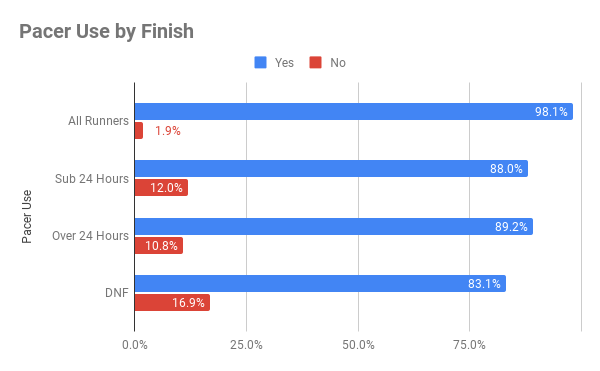
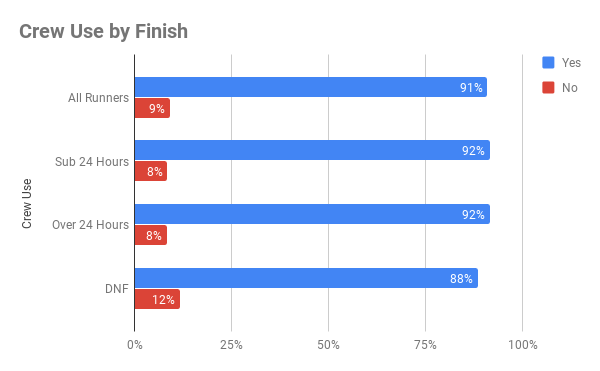
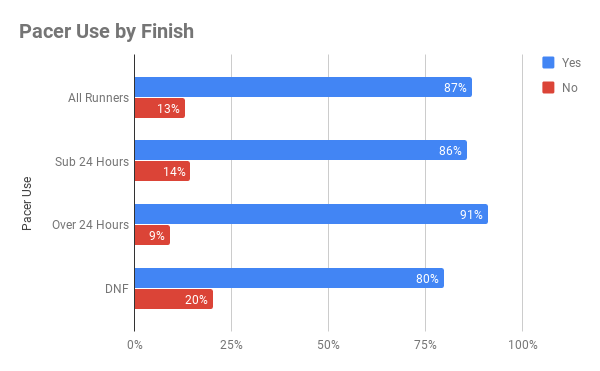
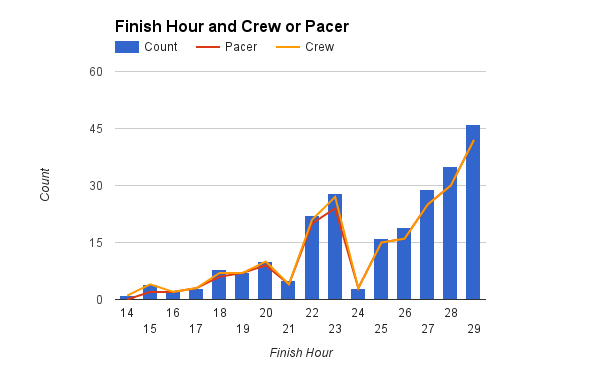
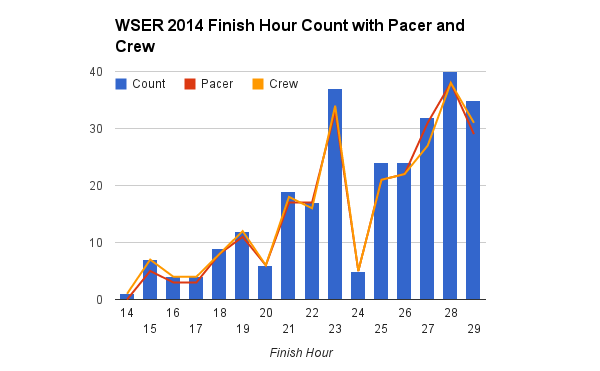
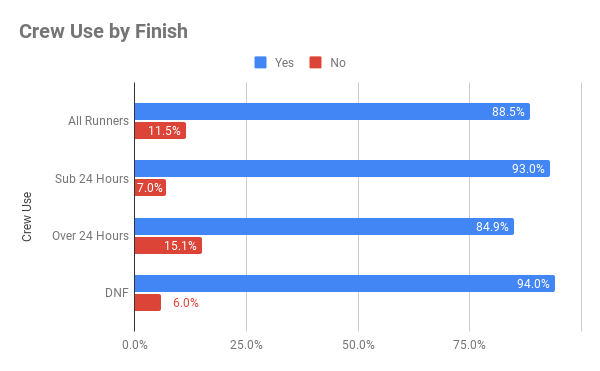
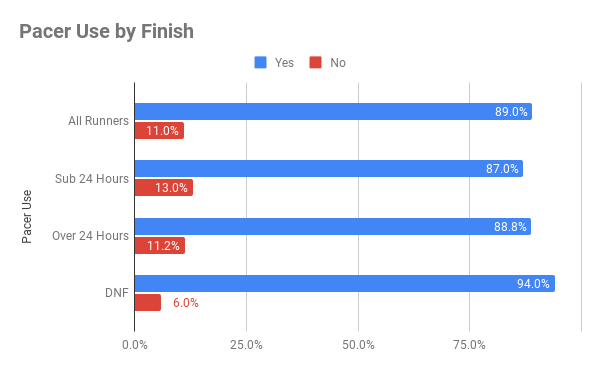
Crew and Pacer
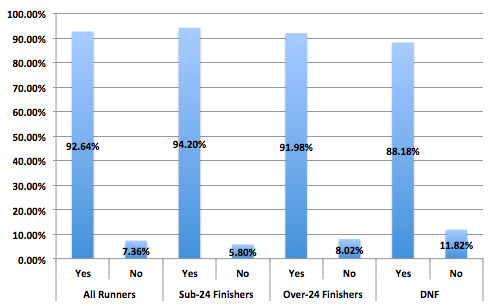
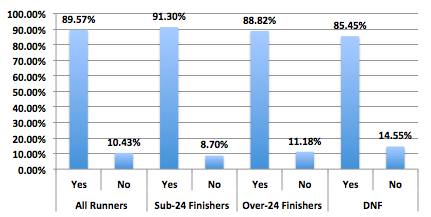
The use of a crew and/or pacer are personal preference during a 100-mile race but may be more popular at WS. The following chart shows the correlation of using a pacer or crew to finish hour. In the overall survey, almost everyone (89%) planned on using a pacer.
Data Accuracy
379 runners started the 2023 Western States 100 Mile Endurance Run
Ultralive.net team surveyed a majority of those runners through the registration process at Olympic Valley. Final survey reflects N = 356 (93.9%) athletes though individual questions may vary if athlete did not answer or know answer. And also note that this analysis was done by amateur statisticians.
Credits
The team would like to thank all of the runners who took time to talk with us and answer these questions. Many thanks to the ultralive.net survey team: Kara Teklinski, Kati Laan and Janeth Siva.
Any feedback or insights are welcome!