The 2019 race lottery will be held on December 1, 2018 in front of a live audience at the Placer High School auditorium in Auburn, CA beginning at 8:30 a.m. PST. We expect to be done by 11:00 a.m. As names are pulled from the hat, they will be posted at https://www.ultralive.net/lottery as close to real-time as possible. There will also be a live video feed on our Facebook Page.
Demand for the race continues to increase as we have seen a 19% increase in the number of applicants for the 2019 lottery. There are 5862 applicants. This compares to 4909 in 2018 and 4248 in 2017.
As described on our lottery page, each runner who enters the lottery and fails to gain entry into the Run (and otherwise doesn’t gain an entry via other means such as an aid station, sponsor, or Altra Golden Ticket spot) will have additional tickets in the hat when entering the lottery the following year, thus improving the probability of being selected. Every lottery applicant will receive 2^(n-1) tickets in the hat where n is the number of consecutive years entering the lottery without gaining entry. That is, 1st year applicants = 1 ticket, 2nd year = 2 tickets, 3rd year = 4 tickets, 4th year = 8 tickets, 5th year = 16 tickets, 6th year = 32 tickets, 7th year = 64 tickets. The maximum number of years for the 2019 lottery is once again 7, or 64 tickets.
You can view the 2019 applicants and their ticket counts and pdf of the 20,119 tickets that will be printed, cut and then put into the barrel.
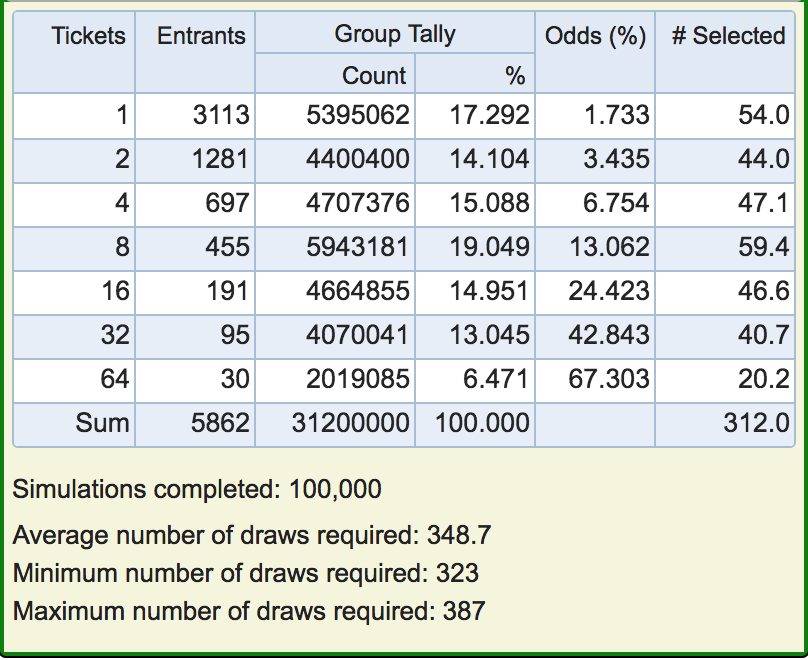
As we began in 2017, we are using a wait list model instead of overbooking like we had for decades to get the target 369 starters which is the number we are legally allowed to run through the Granite Chief Wilderness. 104 of those 369 are automatic entrants. 262 will be drawn in the lottery. The final three entrants to get to 369 will be drawn from those in the audience. We will also draw an additional 50 names for the ordered wait list. The probabilities for being selected as one of the 262 in the lottery or 50 on the wait list (312) are as follows:
- 30 runners with 64 tickets, each has a 67.3% chance of getting drawn (18.1 estimated to be drawn in lottery + 2.1 estimated to be drawn for wait list)
- 95 runners with 32 tickets, each has a 42.8% chance of getting drawn (35.1 + 5.6)
- 191 runners with 16 tickets, each has a 24.4% chance of getting drawn (39.3 + 7.3)
- 455 runners with 8 tickets, each has a 13.1% chance of getting drawn (49.6 + 9.8)
- 697 runners with 4 tickets, each has a 6.8% chance of getting drawn (39.0 + 8.1)
- 1281 runners with 2 tickets, each has a 3.4% chance of getting drawn (36.4 + 7.6)
- 3113 runners with 1 ticket, each has a 1.7% chance of getting drawn (44.5 + 9.5)
So what are the chances of getting into the race if you are selected for the wait list? In 2018 the last person to get a spot on the starting line was drawn 36th on the wait list, in 2017 the 39th person got in. Here is data for the 2018 and 2017 wait lists including when each runner was offered a spot.
Good luck to all.
Discover more from WSER
Subscribe to get the latest posts sent to your email.